


Name
Capella University
MBA-FPX 5008 Applied Business Analytics
Prof. Name
Date
Southwest Airlines Co. is a major U.S. airline known for its low-cost business model, operational efficiency, and customer-focused approach. Founded in 1971 in Dallas, Texas, the company expanded its operations beyond the continental United States to Puerto Rico in 2013 and began international service in 2014. Southwest’s competitive strategy emphasizes affordable air travel, efficient operations, and a distinctive customer experience. Analyzing its stock performance and financial indicators can help investors and business leaders understand the company’s financial position, market risks, and future growth prospects.
Evaluating Southwest Airlines requires more than reviewing stock prices alone. Investors can use financial ratios such as the quick ratio, return on assets, and debt-to-capitalization ratio to assess liquidity, profitability, and financial leverage. Airline-specific performance measures, including available seat miles, revenue per available seat mile, cost per available seat mile, and break-even load factor, also help explain how effectively an airline uses its capacity and manages operating expenses.
This analysis examines Southwest Airlines’ historical stock performance from July 12, 2017, through July 11, 2022, using scatterplots, moving averages, histograms, and descriptive statistics. It also compares Southwest with United Airlines, Delta Air Lines, and American Airlines to identify historical trends, evaluate volatility, and discuss the strategic implications of the findings.
Historical stock data can help identify changes in market sentiment, price volatility, and trading activity. For Southwest Airlines, stock price movements between 2017 and 2022 reflect both company-specific developments and broader economic conditions, including the disruption caused by the COVID-19 pandemic.
The figures accompanying this analysis use historical data from Yahoo! Finance (2022). They illustrate price movements, adjusted closing prices, and trading volume. These visualizations should be interpreted alongside the relevant time period and market conditions because historical patterns do not guarantee future performance.
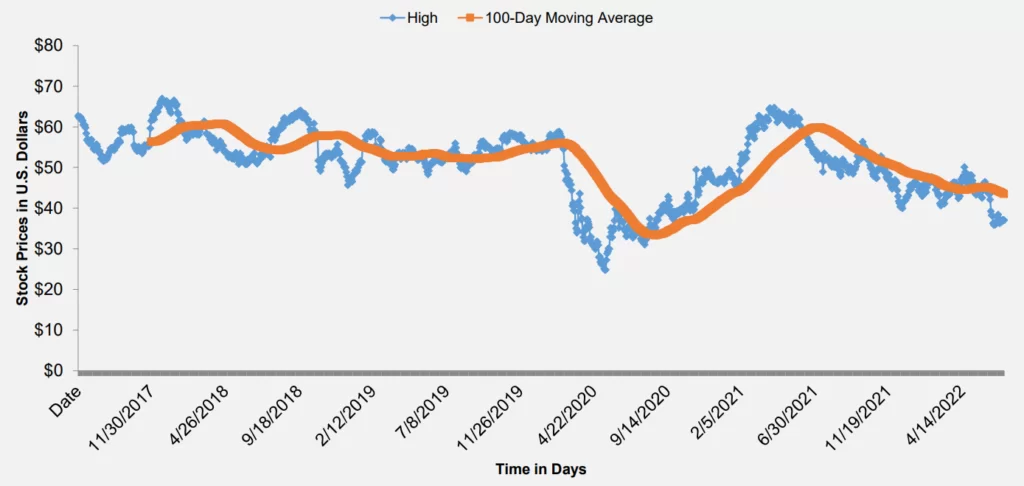
View Figure 1.1: Southwest Airlines’ Highest Stock Prices
The scatterplot compares Southwest Airlines’ historical high stock prices with a 100-day moving average. The moving average smooths short-term price fluctuations, making it easier to identify broader trends over time.
When the stock price remains below its moving average, it may indicate that recent market performance is weaker than the average of the preceding period. However, this relationship is not sufficient by itself to predict future price movements. Investors should also consider company earnings, operating costs, industry conditions, and broader economic developments.
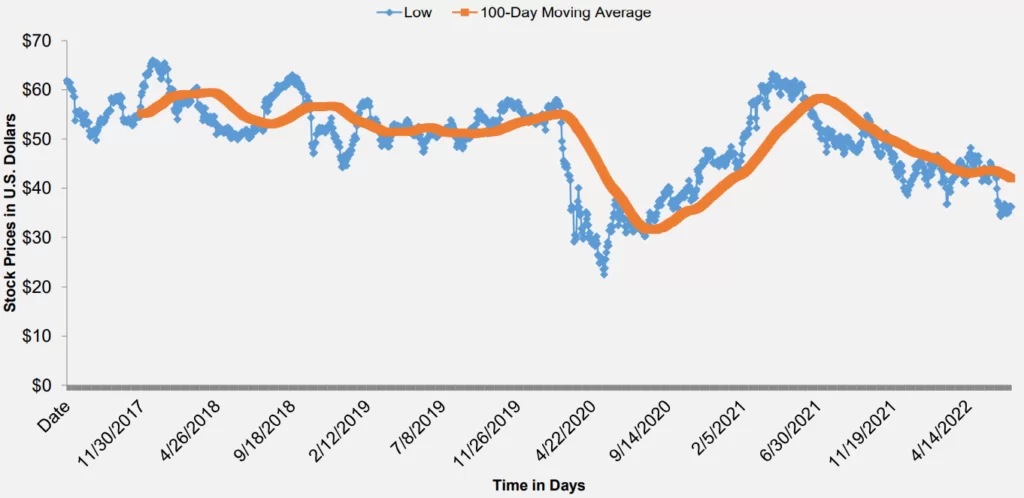
View Figure 1.2: Southwest Airlines’ Lowest Stock Prices
The second scatterplot examines historical low stock prices alongside the same moving-average approach. Analyzing the lowest prices helps illustrate periods when investors placed downward pressure on Southwest’s shares.
Comparing daily highs and lows can reveal the extent of price fluctuations and help identify periods of increased uncertainty. A wider gap between daily highs and lows may indicate greater short-term volatility, although a more complete assessment would also examine daily returns and trading volume.
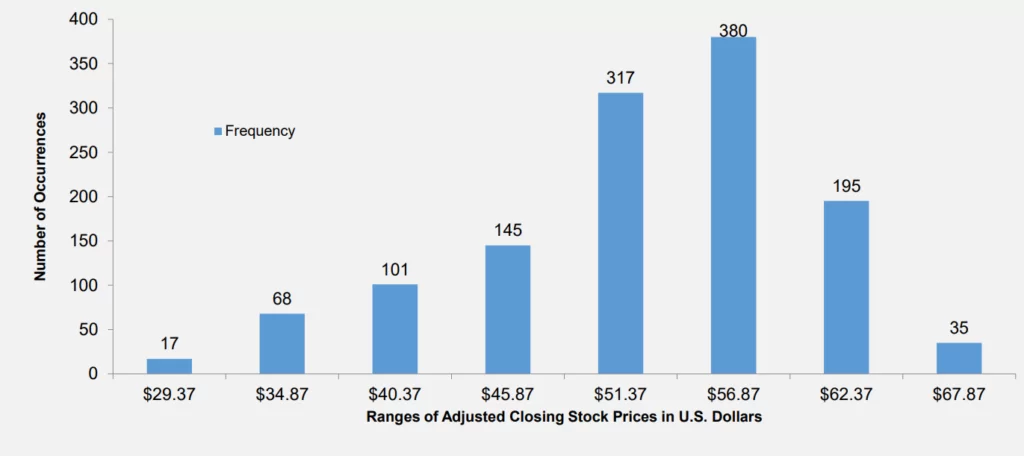
View Figure 2.1: Adjusted Closing Stock Price Distribution
A histogram displays the frequency of adjusted closing prices within specified price ranges. It helps show where stock prices were concentrated during the observation period and whether the distribution appears symmetrical or skewed.
The distribution can provide useful context about the range of historical prices Southwest experienced. However, a histogram of price levels does not directly measure investment risk or the probability of future losses. Investors seeking to understand volatility should also examine daily or weekly percentage returns, standard deviation, and downside risk.
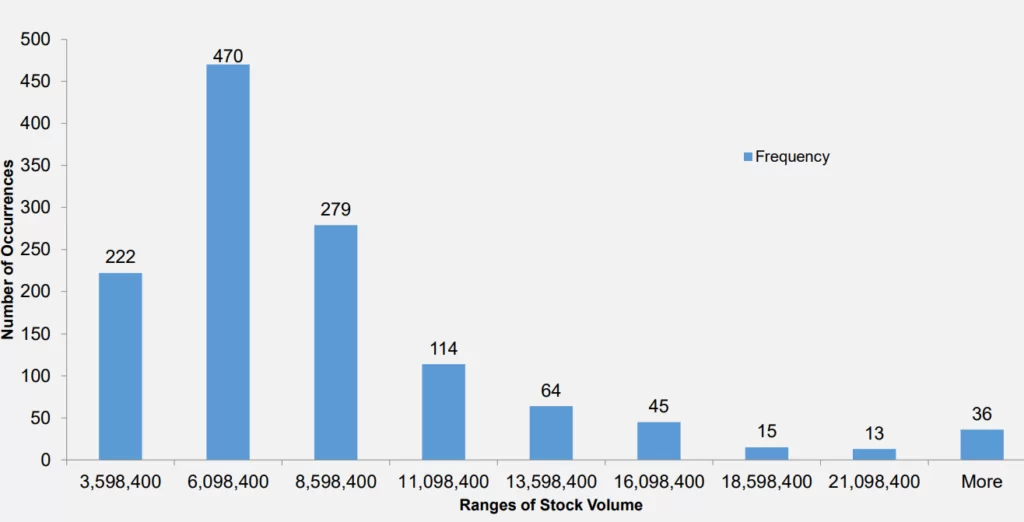
View Figure 2.2: Southwest Airlines’ Historical Trading Volume
Trading volume represents the number of shares exchanged during a particular period. The histogram illustrates the frequency of different trading-volume ranges and can help identify whether activity was concentrated around typical or unusually high-volume days.
Higher trading volume may occur when investors respond to earnings announcements, economic developments, industry news, or changes in market expectations. Volume should not be interpreted as a direct measure of price direction. Instead, it provides additional context for understanding how actively investors traded the stock during significant market events (Lake, 2022).
View the Descriptive Statistics Comparison
The descriptive statistics compare Southwest Airlines with United Airlines, Delta Air Lines, and American Airlines over the historical period from July 12, 2017, through July 11, 2022. The analysis includes the mean, median, and standard deviation of stock prices and daily trading volume.
The mean represents the average observation, while the median identifies the middle value in an ordered dataset. Comparing these two measures can help indicate whether unusually high or low observations influence the average. Standard deviation measures the dispersion of observations around their mean, although the standard deviation of stock price levels should not be treated as directly equivalent to investment volatility.
For a more meaningful comparison of investment risk, the analysis should also calculate the standard deviation of daily stock returns using consistent observation periods. This approach helps account for differences in the share prices of the four airlines.
Trading-volume statistics provide another perspective. Differences in average and median volume may reflect variation in investor participation, company size, liquidity, and responses to market developments. Higher volume does not automatically indicate lower volatility, and comparisons should account for differences in the number of shares outstanding and other relevant market characteristics.
The historical scatterplots indicate changes in Southwest Airlines’ highest and lowest stock prices during the five-year observation period. The COVID-19 pandemic was a major disruption, particularly during the first half of 2020, when travel restrictions, reduced passenger demand, and uncertainty about the recovery of air travel affected the airline industry.
The subsequent price movements illustrate how stock markets responded to changing expectations about economic recovery and airline operations. A stock price falling below its 100-day moving average may signal recent weakness, but moving averages are historical indicators rather than reliable standalone forecasts.
The adjusted closing-price histogram provides a visual summary of the stock’s price distribution. However, the original chart should be examined before drawing conclusions about whether prices are concentrated in higher or lower ranges. Price-level distributions alone do not establish that an investor faced a higher probability of large losses or frequent small gains.
The reported historical volatility of 86.98% also requires careful interpretation. Before using this figure to characterize Southwest Airlines’ investment risk, the calculation method, observation frequency, annualization approach, and underlying return data should be verified. Volatility is generally estimated using the standard deviation of returns rather than the distribution of stock prices alone.
Company earnings, fuel prices, interest rates, passenger demand, labor expenses, and industry announcements can all contribute to stock price fluctuations. Johnson (2020), for example, discussed the movement of airline stocks during the early stages of the pandemic recovery. Such reporting illustrates how changes in market expectations can influence share prices across the industry.
Stock charts are useful for evaluating historical market behavior, but a broader financial assessment should include indicators that measure the airline’s operational performance and financial stability.
The quick ratio measures a company’s ability to cover short-term liabilities using its most liquid assets. For an airline, this indicator can help investors evaluate its capacity to meet near-term obligations, although it should be interpreted alongside cash flow, working capital, and the company’s operating model.
Return on assets measures how effectively a company uses its assets to generate earnings. This measure is particularly relevant for airlines because aircraft, facilities, and other operational assets require substantial investment.
The debt-to-capitalization ratio evaluates the proportion of a company’s capital structure financed through debt. Because airlines face significant aircraft, labor, fuel, and infrastructure costs, financial leverage can influence their ability to withstand periods of weak demand.
These ratios are most informative when compared with historical results, industry benchmarks, and the financial statements of competing airlines. Maverick (2022) discusses several financial measures commonly used to evaluate airline companies.
Available seat miles (ASM) measure an airline’s passenger-carrying capacity by multiplying the number of seats available by the miles flown. Revenue per available seat mile (RASM) measures operating revenue relative to available capacity, while cost per available seat mile (CASM) measures operating costs on the same basis.
The break-even load factor estimates the percentage of available seats that must be filled for an airline to cover the relevant operating costs, based on assumptions about passenger revenue and other operating income. These indicators help Southwest evaluate whether its capacity, pricing, and cost structure support sustainable financial performance.
Monitoring these measures alongside stock performance provides a more complete picture of the company’s operational strengths and financial risks.
The COVID-19 pandemic significantly disrupted air travel, creating uncertainty about passenger demand, flight schedules, revenue, and employment. The resulting changes in travel activity contributed to substantial pressure on airline operations and investor expectations.
Southwest’s recovery depended on the gradual return of travel demand, adjustments to operating capacity, and its ability to manage expenses. The pandemic also demonstrated the importance of maintaining financial flexibility during unexpected disruptions.
Fuel is an important operating expense for airlines, and changes in oil prices can influence profitability. When fuel prices rise, airlines may face pressure on operating margins unless they can offset the increase through pricing, efficiency improvements, or other cost-management measures.
Conversely, lower fuel prices may provide financial relief, although the actual benefit depends on fuel purchasing arrangements, hedging practices, capacity decisions, and other expenses. The relationship between oil prices and airline stock performance is therefore not automatic.
The July 2022 outlook reflected considerable uncertainty about fuel costs and the broader economy. Any claim that a particular international agreement would reduce Southwest’s fuel expenses should be evaluated against the agreement’s actual production effects, timing, and market response.
Workforce availability and employee experience also affect airline performance. Airlines depend on trained employees to maintain operational reliability, safety, and customer service. Recruitment, retention, training, and workforce planning can influence costs and service quality.
Southwest reported in July 2022 that its employee count had exceeded its pre-pandemic 2019 level (Southwest Airlines, 2022). This historical milestone provided context for the company’s recovery, although employee headcount alone does not establish that operational performance or profitability had returned to earlier levels.
Bova (2020) also highlighted the importance of employee experience in Southwest’s business approach. Workforce engagement can support service consistency, but its impact should be assessed alongside measurable operational and customer outcomes.
Southwest operates in a competitive industry affected by unpredictable fuel prices, economic uncertainty, changing travel demand, and operational disruptions. Its strategy should therefore combine cost discipline with investments in reliability, customer service, and financial resilience.
Southwest should monitor fuel expenses, labor costs, aircraft utilization, and other major operating expenditures. Scenario planning can help management assess how different combinations of higher fuel prices, weaker passenger demand, or slower economic growth could affect profitability and liquidity.
Maintaining appropriate cash reserves and managing debt responsibly can also help the company respond to unexpected disruptions. Financial decisions should be evaluated alongside the airline’s long-term operational requirements rather than focusing exclusively on short-term stock performance.
Southwest should use operational data to evaluate aircraft utilization, flight scheduling, turnaround times, and capacity planning. Improvements in these areas may help reduce avoidable costs while maintaining service quality and safety.
Management should monitor available seat miles, revenue per available seat mile, cost per available seat mile, and break-even load factor to understand how efficiently the airline converts capacity into revenue. These measures can help identify opportunities to improve profitability without relying solely on fare increases.
Southwest should continue investing in employee development, service consistency, and customer communication. Employees who receive appropriate training and support are better positioned to respond to operational challenges and customer concerns.
The company should also evaluate customer feedback, complaint trends, service disruptions, and employee retention. These indicators can help management identify recurring problems and assess whether workforce and customer-experience initiatives are producing measurable improvements.
Southwest should combine historical stock data with financial statements, operational performance measures, and industry trends when evaluating strategic decisions. Scatterplots, histograms, moving averages, and descriptive statistics are useful analytical tools, but they should be interpreted alongside return-based volatility measures and relevant business information.
Comparisons with United Airlines, Delta Air Lines, and American Airlines should use consistent dates, definitions, and calculation methods. This will help ensure that differences in financial performance reflect meaningful business characteristics rather than inconsistencies in the underlying data.
Historical price movements and technical indicators can provide useful information, but they should not be treated as sufficient evidence for buying or selling shares. Investors should consider profitability, liquidity, debt, competitive positioning, economic conditions, and their own risk tolerance.
A historical Zacks rating reported in July 2022 should also be understood in its original context rather than treated as a current investment recommendation. Ratings and stock prices change over time, and the information presented in this analysis does not establish Southwest’s current valuation or investment outlook.
The historical analysis of Southwest Airlines’ stock performance from July 2017 through July 2022 demonstrates how financial markets responded to company developments, industry pressures, and the COVID-19 pandemic. Scatterplots and moving averages help illustrate price trends, while histograms summarize the distribution of stock prices and trading volume. Descriptive statistics provide a basis for comparing Southwest with United Airlines, Delta Air Lines, and American Airlines.
However, stock-price patterns alone cannot establish future performance or provide a complete measure of investment risk. A stronger evaluation combines historical returns and volatility with liquidity ratios, profitability measures, financial leverage, and airline-specific indicators such as available seat miles, revenue per available seat mile, and cost per available seat mile.
Southwest’s long-term performance depends on its ability to manage fuel and labor costs, maintain operational reliability, respond to changing travel demand, and deliver a positive customer experience. By combining disciplined financial management with data-driven operational planning, the company can improve its ability to navigate uncertainty and support sustainable performance. Investors should use the historical findings as one part of a broader assessment rather than as a standalone forecast of future stock prices.
MBA FPX 5008 Assessment 4, Presenting Data Analysis Results Effectively, focuses on communicating analytical findings through data visualizations, descriptive statistics, and evidence-based interpretations. In this Southwest Airlines analysis, stock charts and comparative statistics are used to examine historical price movements, trading activity, and financial considerations.
Important financial ratios include the quick ratio, return on assets, and debt-to-capitalization ratio. These measures help assess liquidity, asset efficiency, and financial leverage. Investors should also review cash flow, profitability, and airline-specific operating indicators.
The pandemic disrupted passenger demand and airline operations, contributing to substantial uncertainty across the industry. Changes in travel restrictions, operating capacity, economic conditions, and expectations for recovery influenced airline stock prices during 2020 and the following period.
A 100-day moving average calculates the average stock price over a rolling period of approximately 100 trading days. It smooths short-term fluctuations and helps investors identify broader historical trends. However, it does not guarantee that prices will rise or fall in the future.
Trading volume measures the number of shares exchanged during a period. Changes in volume can indicate increased investor activity around earnings announcements, industry developments, or economic news. Volume is most useful when interpreted alongside price changes and other market indicators.
Southwest can improve financial resilience through disciplined cost management, liquidity planning, operational efficiency, and scenario analysis. Monitoring fuel prices, labor expenses, passenger demand, and debt levels can help management prepare for adverse market conditions.
Available seat miles, revenue per available seat mile, cost per available seat mile, and break-even load factor are important airline-specific indicators. They help evaluate capacity, revenue generation, operating expenses, and the passenger demand required to cover costs.
No. Historical stock performance can reveal past patterns and help investors understand market behavior, but it cannot reliably predict future returns on its own. Investment decisions should also consider current financial results, industry conditions, valuation, economic risks, and individual investment objectives.
Bova, T. (2020, November 17). Southwest on the importance of employee experience. Forbes. https://www.forbes.com/sites/salesforce/2020/11/17/southwest-on-the-importance-of-employee-experience/
Corporate Finance Institute. (2022, May 7). Negatively skewed distribution. https://corporatefinanceinstitute.com/resources/knowledge/other/negatively-skewed-distribution/
Johnson, M. (2020, June 4). Why did airline stocks skyrocket on Thursday? Zacks Investment Research. https://www.zacks.com/stock/news/964436/why-did-airline-stocks-skyrocket-on-thursday
Lake, R. (2022, April 12). Should you pay attention to a stock’s trading volume? SmartAsset. https://smartasset.com/financial-advisor/high-volume-stocks
Maverick, J. B. (2022, March 28). Key financial ratios for airline companies. Investopedia. https://www.investopedia.com/articles/active-trading/082615/key-financial-ratios-analyze-airline-companies.asp
Morah, C. (2021, July 28). Are stocks with large daily volume less volatile? Investopedia. https://www.investopedia.com/ask/answers/09/daily-volume-volatility.asp
Southwest Airlines. (n.d.). Corporate fact sheet. Southwest Airlines Newsroom. https://www.swamedia.com/pages/corporate-factsheet
Southwest Airlines. (n.d.). Purpose, vision, and the Southwest way. Southwest Airlines Investor Relations. https://www.southwestairlinesinvestorrelations.com/our-company/purpose-vision-and-the-southwest-way
Southwest Airlines. (2022, July 15). Southwest Airlines achieves hiring milestone by increasing employee count beyond pre-pandemic 2019 levels. Southwest Airlines Newsroom. https://www.swamedia.com/releases/southwest-airlines-achieves-hiring-milestone-by-increasing-employee-count-beyond-pre-pandemic-2019-levels
Southwest Airlines Co. (2020, April 28). Southwest Airlines announces offering of common stock and convertible senior notes due 2025. PR Newswire. https://www.prnewswire.com/news-releases/southwest-airlines-announces-offering-of-common-stock-and-convertible-senior-notes-due-2025-301048250.html
The Geography of Transport Systems. (2022, June 25). Market share of the top American airlines, 1977–2022. https://transportgeography.org/contents/chapter5/air-transport/airline-market-share-united-states/
The White House. (2022, July 15). Fact sheet: Results of bilateral meeting between the United States and the Kingdom of Saudi Arabia. https://www.whitehouse.gov/briefing-room/statements-releases/2022/07/15/fact-sheet-results-of-bilateral-meeting-between-the-united-states-and-the-kingdom-of-saudi-arabia/
Yahoo Finance. (2022, July 17). American Airlines Group Inc. (AAL) historical data. https://finance.yahoo.com/quote/AAL/history/
Yahoo Finance. (2022, July 17). Delta Air Lines, Inc. (DAL) historical data. https://finance.yahoo.com/quote/DAL/history/
Yahoo Finance. (2022, July 12). Southwest Airlines Co. (LUV) historical data. https://finance.yahoo.com/quote/LUV/history/
Yahoo Finance. (2022, July 17). United Airlines Holdings, Inc. (UAL) historical data. https://finance.yahoo.com/quote/UAL/history/
Zacks Investment Research. (2022, July 17). Southwest Airlines Co. (LUV): Key company metrics. https://www.zacks.com/stock/research/LUV/key-company-metrics
Fidelity Investments. (2022, June 17). Moving averages. https://www.fidelity.com/viewpoints/active-investor/moving-averages