

Name
Capella University
RSCH-FPX 7864 Quantitative Design and Analysis
Prof. Name
Date
The following table presents the descriptive statistics for the final exam scores among lower and upper division students.
| Lower Division | Upper Division | |
|---|---|---|
| Valid | 49 | 56 |
| Missing | 0 | 0 |
| Mean | 61.469 | 62.161 |
| Standard Deviation | 8.595 | 6.747 |
| Minimum | 40.000 | 50.000 |
| Maximum | 75.000 | 74.000 |
The histogram for the final exam results of 49 lower division students reveals the following distribution: Two students scored between 40 and 45, three students between 45 and 50, eight students between 50 and 55, seven students between 55 and 60, twelve students between 60 and 65, seven students between 65 and 70, and ten students scored between 70 and 75. This analysis indicates that the majority of lower division students scored between 60.1 and 65 on their final exams, with the histogram exhibiting a left skew. According to Glen (2022), “left skewed histograms are histograms with long tails on the left.” In the lower division, the mean score is 61.469, while the median, calculated as (60 + 65)/2, is 62.5. Since the median is higher than the mean, it confirms that the histogram is indeed skewed to the left.

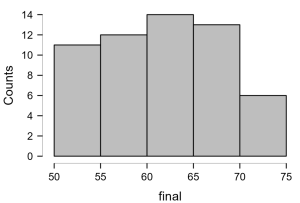
Similarly, the histogram for the final exams of 56 upper division students shows that eleven students scored between 50 and 55, twelve students between 55 and 60, fourteen students between 60 and 65, thirteen students between 65 and 70, and six students between 70 and 75. The distribution for the upper division indicates that most students scored between 60.11 and 65. This histogram aligns with a normal distribution, characterized by a bell-shaped curve where data is symmetrically distributed around the mean, with frequency counts peaking in the center and tapering off on either side. The mean score for the upper division is 62.161, while the median remains the same as that of the lower division at (60 + 65)/2 = 62.5. The mean and median being nearly equal signifies a typical normal distribution. The National Institute of Health (n.d.) notes, “a variable that is normally distributed has a histogram (or ‘density function’) that is bell-shaped, with only one peak, and is symmetric around the mean.”
| GPA | Quiz 3 | |
|---|---|---|
| Mean | 2.862 | 7.133 |
| Standard Deviation | 0.713 | 1.600 |
| Skewness | -0.220 | -0.078 |
| Kurtosis | -0.688 | 0.149 |
In this analysis, the GPA indicates a slight right skew and a distribution that is somewhat flatter than normal. Conversely, Quiz 3 reveals a minor skew, with its distribution appearing more peaked than usual. A skewness value falling between -0.5 and 0.5 suggests a relatively symmetric distribution. Thus, both GPA and Quiz 3 scores fall within the normal skewness range. Furthermore, regarding kurtosis, both distributions deviate from normality. Skewness and kurtosis can provide insights into the nature of the distribution.
Muhammad (2021) states, “The skewness of the distribution is used to determine whether it is normal, left-tailed, or right-tailed, while the kurtosis is applied to check the height of the distribution” (p. 1227). The skewness for GPA is -0.220, indicating a slight leftward tilt, while Quiz 3 shows a skewness of -0.078, suggesting near symmetry. The kurtosis for GPA is -0.688, indicating a flat distribution, whereas Quiz 3, with a kurtosis of 0.149, reflects a peak distribution. Notably, values closer to zero indicate a normal kurtosis; thus, Quiz 3 displays characteristics more aligned with a normal distribution compared to GPA.
Glen, S. (2022). Skewed distribution: Definition, examples. Statistics How To. https://www.statisticshowto.com/probability-and-statistics/skewed-distribution/
Muhammad, A. (2021). A study on skewness and kurtosis estimators of wind speed distribution under indeterminacy. Theoretical and Applied Climatology, 143(3-4), 1227-1234. https://doi.org/10.1007/s00704-020-03509-5
National Institute of Health. (n.d.). Learn more about normal distribution. Dietary assessment primer. https://dietassessmentprimer.cancer.gov/learn/distribution.html#:~:text=The%20%22normal%2 0distribution%22%20is%20the